A score for the distribution
A June 2024 World Bank research paper describes the Gini index on a scale from 0 to 100: lower values indicate a more equal distribution of income or consumption. Zero means everyone has an equal share; 100 is the maximum-inequality benchmark. The alternative 0–1 scale expresses the same measure: 0.30 and 30 correspond. Source: World Bank Working Paper 10796, June 2024, Box 1.
Think of it as a compact description of the gaps between people. It is not a happiness rating, a measure of anyone's effort or a percentage of people living in poverty.
Four pixel people, one useful experiment
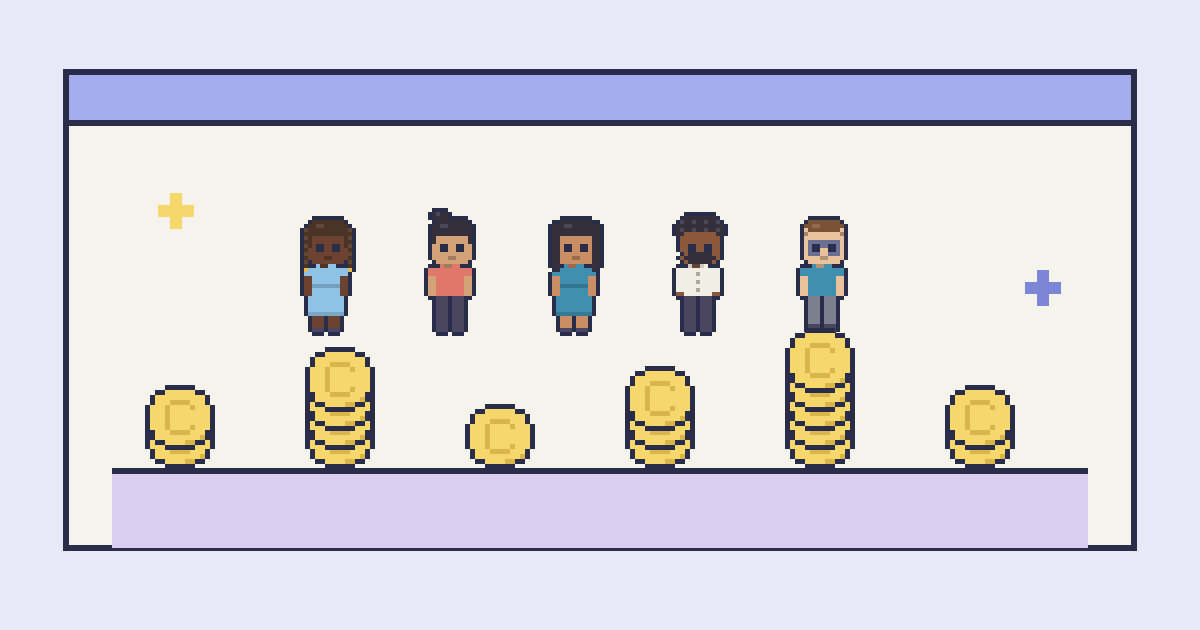
Here is a completely fictional village with four residents. Their weekly incomes are 2, 4, 6 and 8 tokens. Using the standard population Gini calculation, this tiny distribution has an index of 25.
Now double every income to 4, 8, 12 and 16 tokens. Keep prices unchanged in our imaginary world. Everyone can buy twice as much, but the Gini remains 25: each person still receives the same fraction of the total. The first resident receives one tenth in both versions.
Add an invented poverty threshold of 5 tokens a week. In the first village, two of four residents are below it: 50%. After the increase, only one of four is below it: 25%. The poverty rate falls even though this inequality score stays fixed. These are our calculations using made-up tokens, not observations about a real country.
Poverty asks where a threshold sits
For a real reference point, the World Bank's June 2025 update set its international extreme-poverty line at $3.00 per person per day in 2021 purchasing-power-parity dollars. PPP accounts for price differences between countries; this is not simply three US dollars converted at today's exchange rate. That release estimated 838 million people below the line in 2022. Both the estimate's year and its June 2025 revision matter. Source: World Bank poverty-line factsheet, 5 June 2025.
Return to our four residents. If everyone instead received 2 tokens, the Gini would be zero, yet everyone would be below our five-token threshold. Equal shares and sufficient resources are separate questions. That is why a distribution measure and a poverty measure can be useful together.
The same score can hide different stories
The World Bank's indicator notes that different income distributions can produce the same Gini. It also warns that differences in household surveys, reference years and income-versus-consumption measures limit comparisons. Source: World Bank Gini metadata.
To see why details matter, invent two three-person villages: one receives 10, 10 and 40 tokens; the other receives 0, 30 and 30. Both total 60 and both have a Gini of about 33.3. Yet the lowest income is 10 in the first and zero in the second. A shared score has not made their circumstances identical.
Read the label before the leaderboard
Before comparing two numbers, check the scale, year, population and what was measured. Then look for the underlying distribution and a clearly defined poverty measure.
In 1 in 8 Billion, a small character invites you to imagine a whole life. Bring that same curiosity to a statistic. The score can open the story, but understanding the people requires another look.
FOLLOW YOUR CURIOSITY
Sources & further reading
- World Bank: The World Bank’s New Inequality Indicator ↗
Policy Research Working Paper 10796, June 2024. Box 1 defines the Gini scale and population formula used for our fictional calculations.
- World Bank: June 2025 Update to Global Poverty Lines ↗
Published 5 June 2025. Supports the $3.00 daily line in 2021 PPP international dollars and the release’s 838 million estimate for 2022. This article identifies the vintage rather than presenting it as the newest estimate.
- World Bank: Gini index metadata ↗
Definition consulted 27 October 2026. Explains non-unique distributions, household survey dates and limits to comparing income and consumption measures.
Sources and game details checked on 27 October 2026. Suggest a correction.