
Income is a flow; wealth is a balance
Income needs a time period: per week, per month or per year. For its income inequality indicator, the OECD uses annual household disposable income, including cash transfers and subtracting income taxes and social contributions. Source: OECD income definition.
Wealth asks a different question: what is owned, minus what is owed, at a point in time? That is the basic net-worth calculation in the OECD household net worth definition. A useful picture is a stream flowing into a reservoir. The stream tells you about arrivals; the reservoir tells you about what has accumulated.
Meet two fictional neighbours
Imagine Ada and Bo, two invented pixel people who each receive 20 tokens a month. Ada has 90 tokens in savings and no debt. Bo has 10 saved and owes 30. Their net wealth is therefore 90 and minus 20 tokens, respectively.
Now give both the same surprise: a broken bicycle that costs 25 tokens to repair. Ada can use savings immediately. Bo cannot cover the bill from savings alone. In this deliberately simple example, an identical event creates different decisions, even though the monthly income label looks identical.
Change the example again. Suppose Ada's 90 tokens are tied up in a small house instead of savings. The wealth figure stays the same, but paying the repair bill becomes less straightforward. Our invented balance sheet needs more detail than one total. A house and a pocketful of spendable tokens are not interchangeable on the day the bicycle breaks.
The average can rise while most people stand still
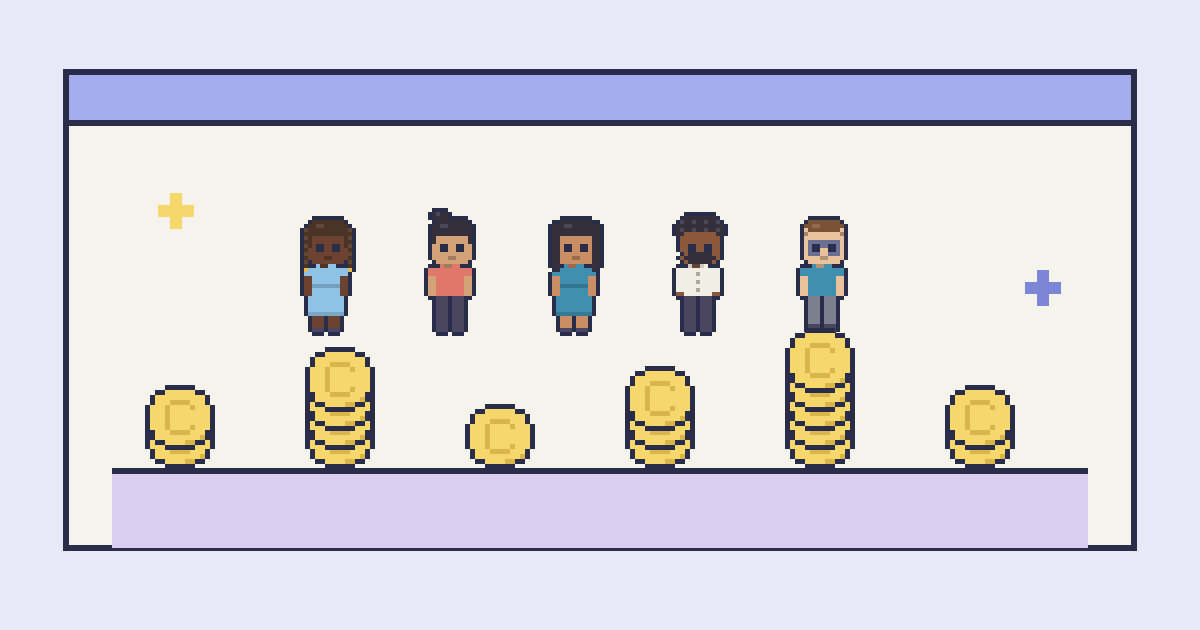
Line up five more fictional residents with monthly incomes of 20, 20, 20, 20 and 120 tokens. Together they receive 200, so the mean is 40. The middle person's income, the median, is 20. Nobody in this village actually receives the mean.
Next month, only the highest income changes, from 120 to 320. The total becomes 400 and the mean doubles to 80. The other four incomes and the median remain 20. An accurate headline about a rising average would still tell you very little about those four lives.
A dated view of the real world
The World Inequality Report 2022 estimated that the highest-income 10% of adults received 52% of global income in 2021. Separately, the wealthiest 10% held 76% of global household wealth. These are different rankings, so they need not contain exactly the same people. The figures use purchasing power parity; income is measured after pension and unemployment arrangements but before other taxes and transfers. Source: World Inequality Lab, chapter 1, 2021 estimates.
Those percentages describe distributions. They cannot tell us how a particular person will live, what they value or what happens next.
Give the numbers a second question
When a statistic catches your eye, ask whether it describes income or wealth, which year it covers and whether its average is a mean or a median. Then ask what the total leaves out.
That curiosity fits a game about possible lives. Follow your pixel person's story, while remembering that the token examples here are explanatory inventions, not app mechanics or forecasts. A starting point adds context to a life; it does not write its ending.
FOLLOW YOUR CURIOSITY
Sources & further reading
- OECD: Income inequality ↗
Definition consulted 27 October 2026. Describes annual household disposable income and deductions; not the same income concept as the WID estimate.
- OECD: Household net worth ↗
Definition consulted 27 October 2026. Supports net worth as assets minus outstanding liabilities. The fictional token examples are our own.
- World Inequality Report 2022: Global economic inequality ↗
Chapter 1, especially Figure 1.1 and Box 1.1. Estimates for 2021 cover adults, use PPP, and apply the report’s pre-tax income definition. Top income and wealth groups are separate rankings.
Sources and game details checked on 27 October 2026. Suggest a correction.